Research note
More Effort, No Miracle: On DeepSWE, Extra Reasoning Leaves Mostly Noise-Like Variation
A four-run, multi-model research note: above High on DeepSWE v1.1, measured resource use keeps rising, while 11 of 12 score changes remain indistinguishable from finite-repeat variation.
This is an English translation of an article originally written in Chinese. Read the Chinese original.
8 min read
Contents
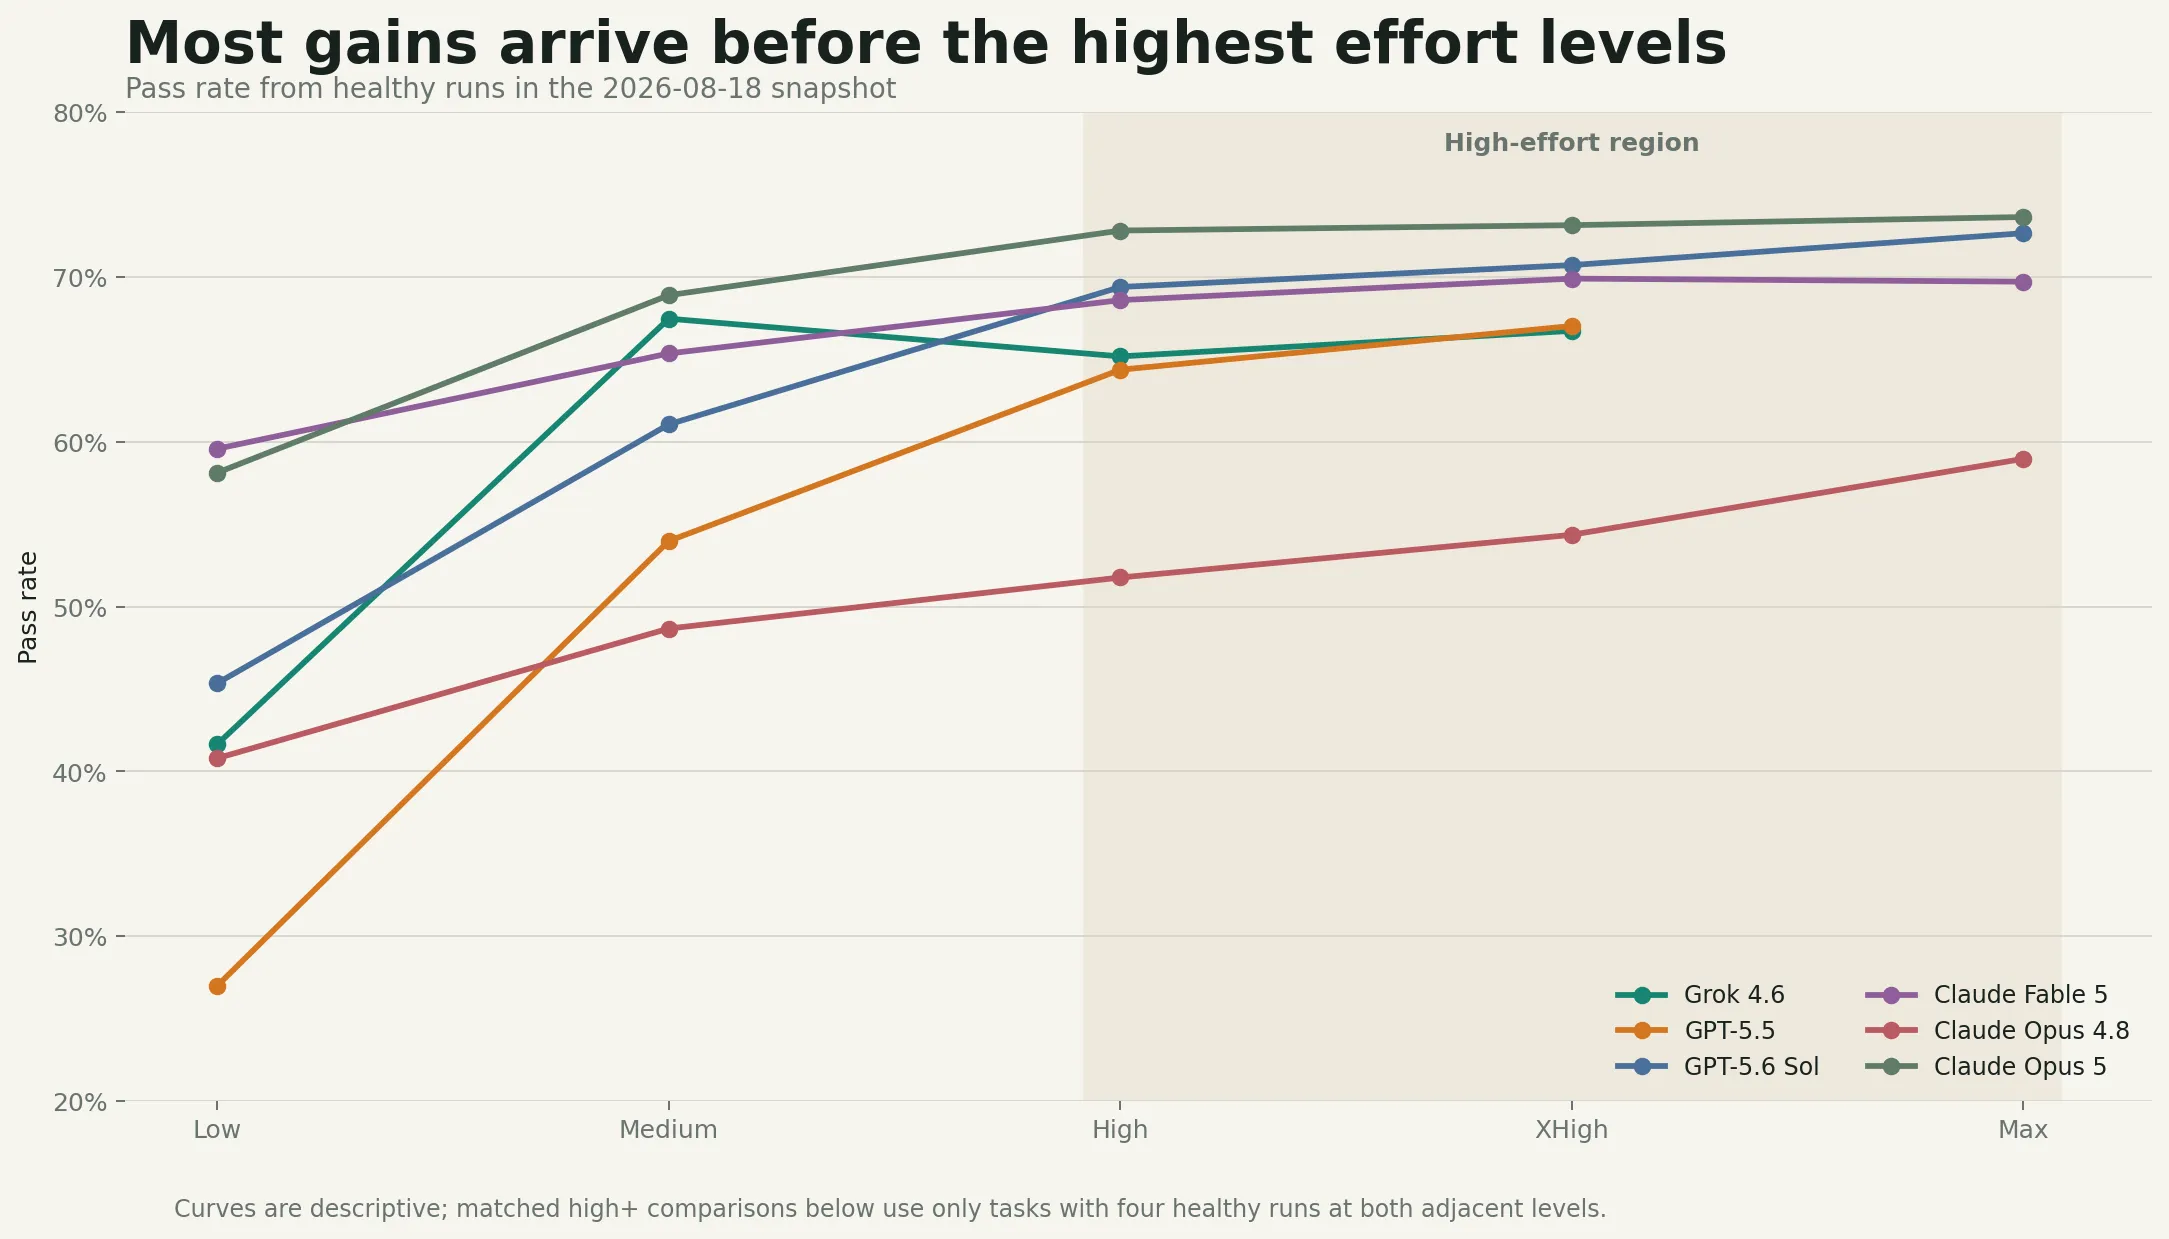
The sharpest result is not simply that DeepSWE scores flatten above High. It is how difficult those movements are to separate from noise: across 12 High→XHigh and XHigh→Max comparisons, 11 observed score differences remain inside the 95% interval produced by 100,000 random regroupings of four-run outcomes.
Meanwhile, the models do not compute less. Steps, tokens, and cost continue to rise. This research note preserves the analysis needed to reach a narrower, testable conclusion: for these models, this snapshot, and four repetitions per task, additional measured test-time resource use above High is difficult to convert into stable task-success gains. Most observed task-level changes are compatible with finite-repeat variation.
“Compatible” does not prove that every change is random. It means the current experiment cannot reliably distinguish most of them from a simple no-effort-effect baseline.
The code, frozen derived data, statistical tests, and English-language figures are available in the public companion repository. The public package excludes raw trajectories, model patches, verifier output, trial IDs, and task names.
Fixing the comparison before interpreting it
DeepSWE is a coding-agent benchmark with 113 original, long-horizon software-engineering tasks. Configurations run through a common agent harness and are scored by functional verifiers. It measures model configurations in a fixed environment, not the global quality of a model or coding product. The DeepSWE paper describes the benchmark design and its limitations.
I froze the analysis at the 2026-08-18 snapshot. Each model × effort × task cell contains up to four runs. The rules are:
- Keep only healthy runs included by the benchmark’s scoring rules. Provider, network, and verifier failures are excluded rather than scored as quality failures; failures inside an otherwise valid run, including timeouts, still count as failures.
- Compare adjacent effort levels only when the same task has exactly four healthy runs at both levels.
- The strict high-effort cohort includes only High→XHigh and XHigh→Max: seven models and 12 adjacent-level comparisons.
- The unit of analysis is model × adjacent level × task. There are 1,279 instances, each containing four binary outcomes before and four after.
- Instances are equally weighted in the pooled summaries. Similar model names never cause distinct configurations to be merged.
The overview already suggests diminishing returns, but aggregate scores can conceal two very different stories: every task may improve slightly, or one group may improve while another regresses. Distinguishing them requires the four-run task-level outcomes.
Aggregate calm, task-level churn
Pooled across the 12 strict comparisons, per-run pass rate rises from 63.08% to 65.30%, a gain of 2.23 percentage points. Yet task coverage—solved at least once in four attempts—moves from 84.36% to 84.28%. Sixty-six instances gain coverage, 67 lose it entirely, and the net is -1.
The shape of the changes is more revealing. Of 1,279 instances, 579 change their success count. But 416 of those changes—71.8%—differ by only one success. No instance moves from 0/4 to 4/4. The only complete reversal goes in the other direction, from 4/4 to 0/4.
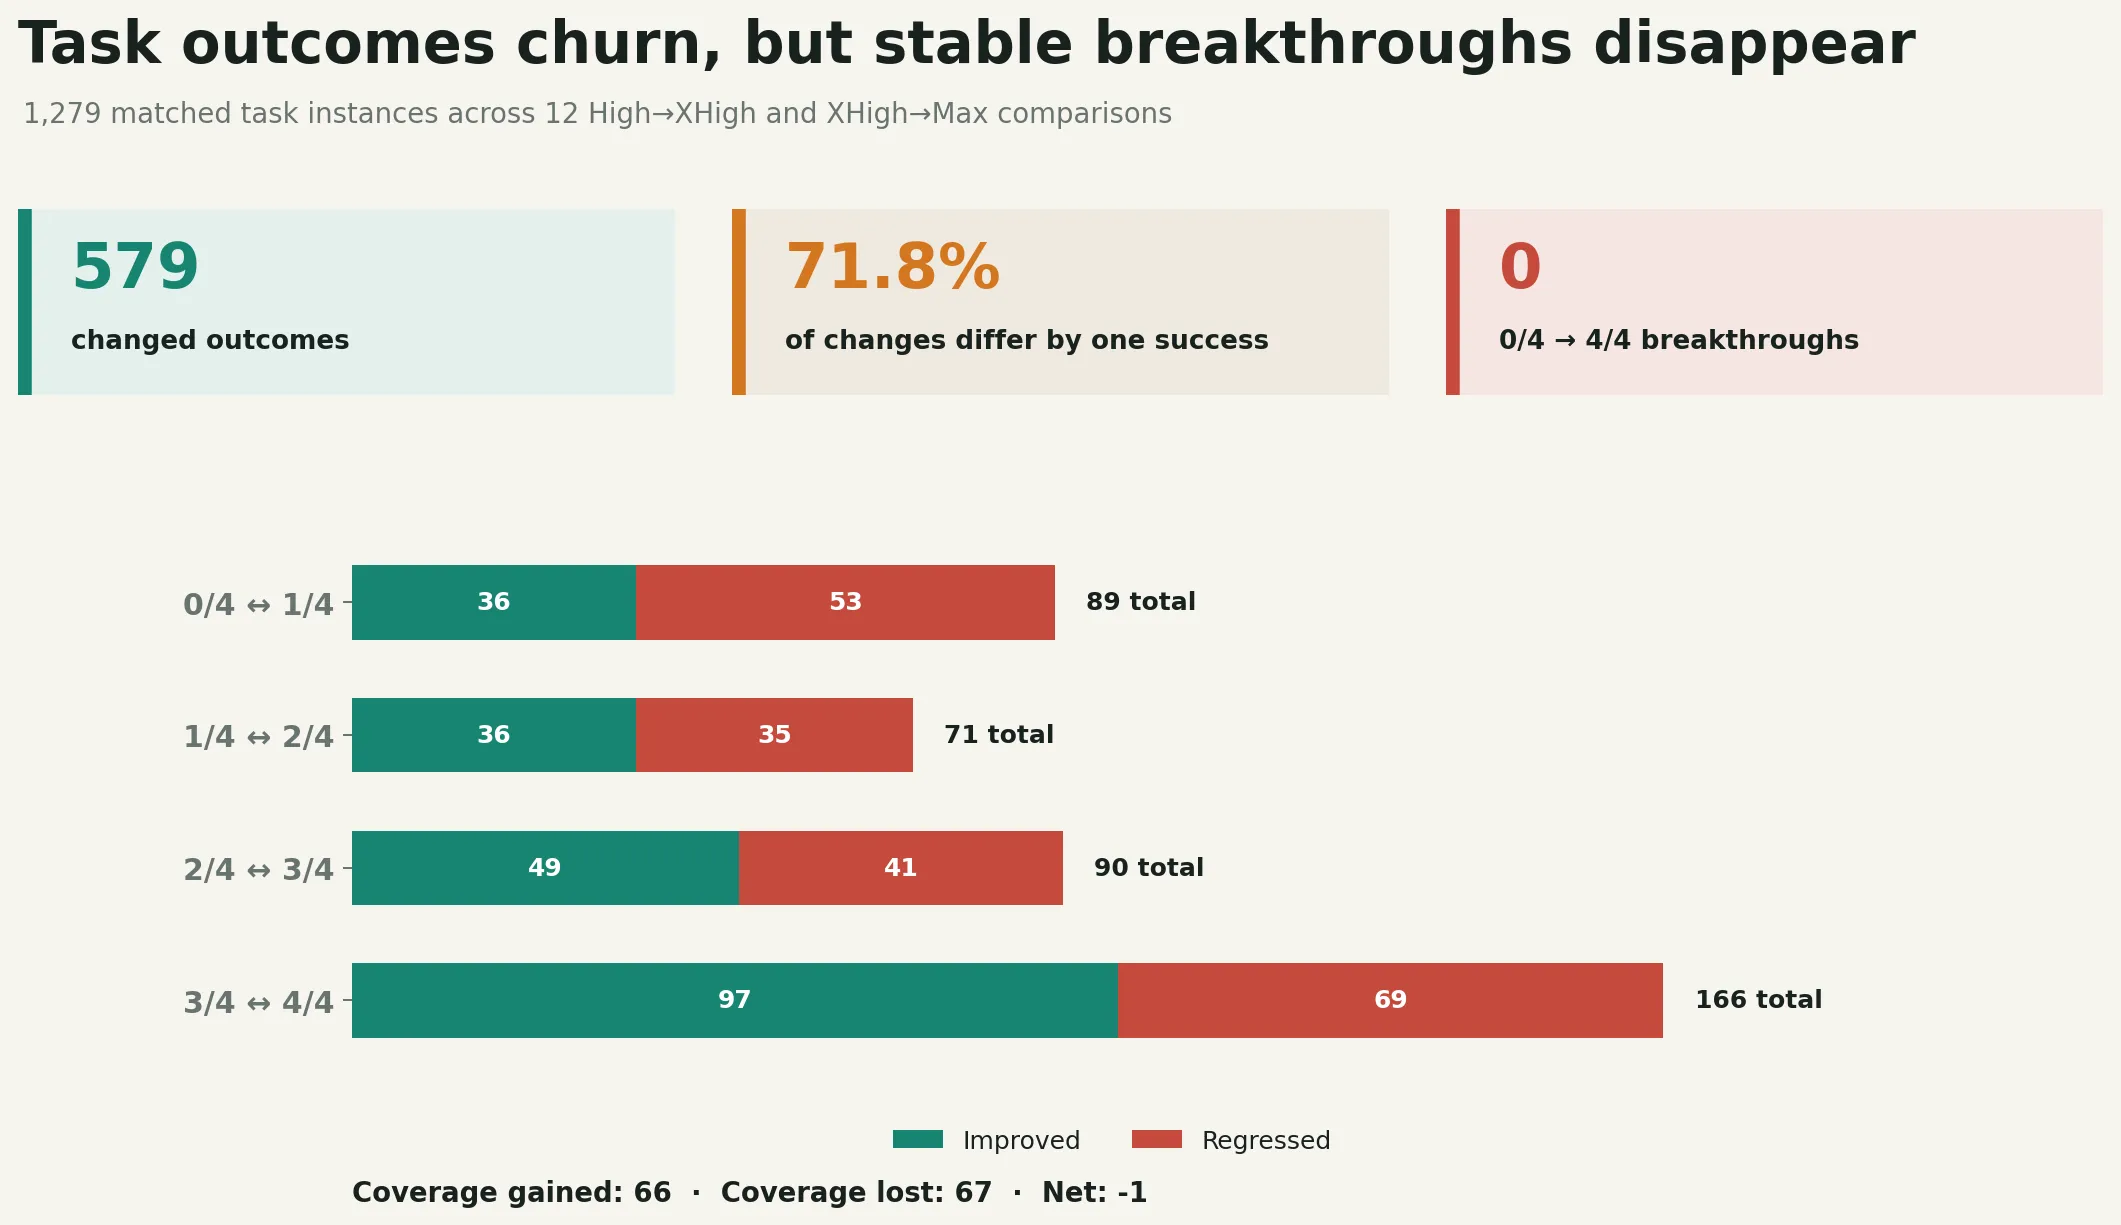
This is why “many swaps” does not imply “large capability gains.” With four repetitions, a move from 1/4 to 2/4 may reflect a small real probability shift or ordinary sampling variation. It needs structural evidence.
I checked two forms of structure. First, the external difficulty distributions of improved and regressed tasks overlap heavily; there is no consistent split in which hard tasks improve while easy ones regress. Second, the mean pairwise Jaccard similarity between models’ regressed-task sets is low: 0.140 for High→XHigh and 0.083 for XHigh→Max. Even within the same model, overlap between regressions in the two consecutive ranges never exceeds 0.091.
The changes are not only small; they also fail to concentrate on a stable set of tasks.
Above High, 11 of 12 differences stay inside the noise baseline
To build a direct baseline for four-run variation, I used a paired randomization test. For each task, the eight fixed success/failure outcomes across two adjacent levels remain unchanged. I randomly repartition those eight outcomes into groups of four and recompute the higher-minus-lower total success-count difference. Repeating this 100,000 times gives a 95% interval under a no-effort-effect null.
The contrast is sharp:
- Across 15 Low→Medium and Medium→High comparisons, nine observed changes fall outside the random 95% interval.
- Across 12 High→XHigh and XHigh→Max comparisons, only one nominally falls outside. That exception is not corrected for multiple comparisons.
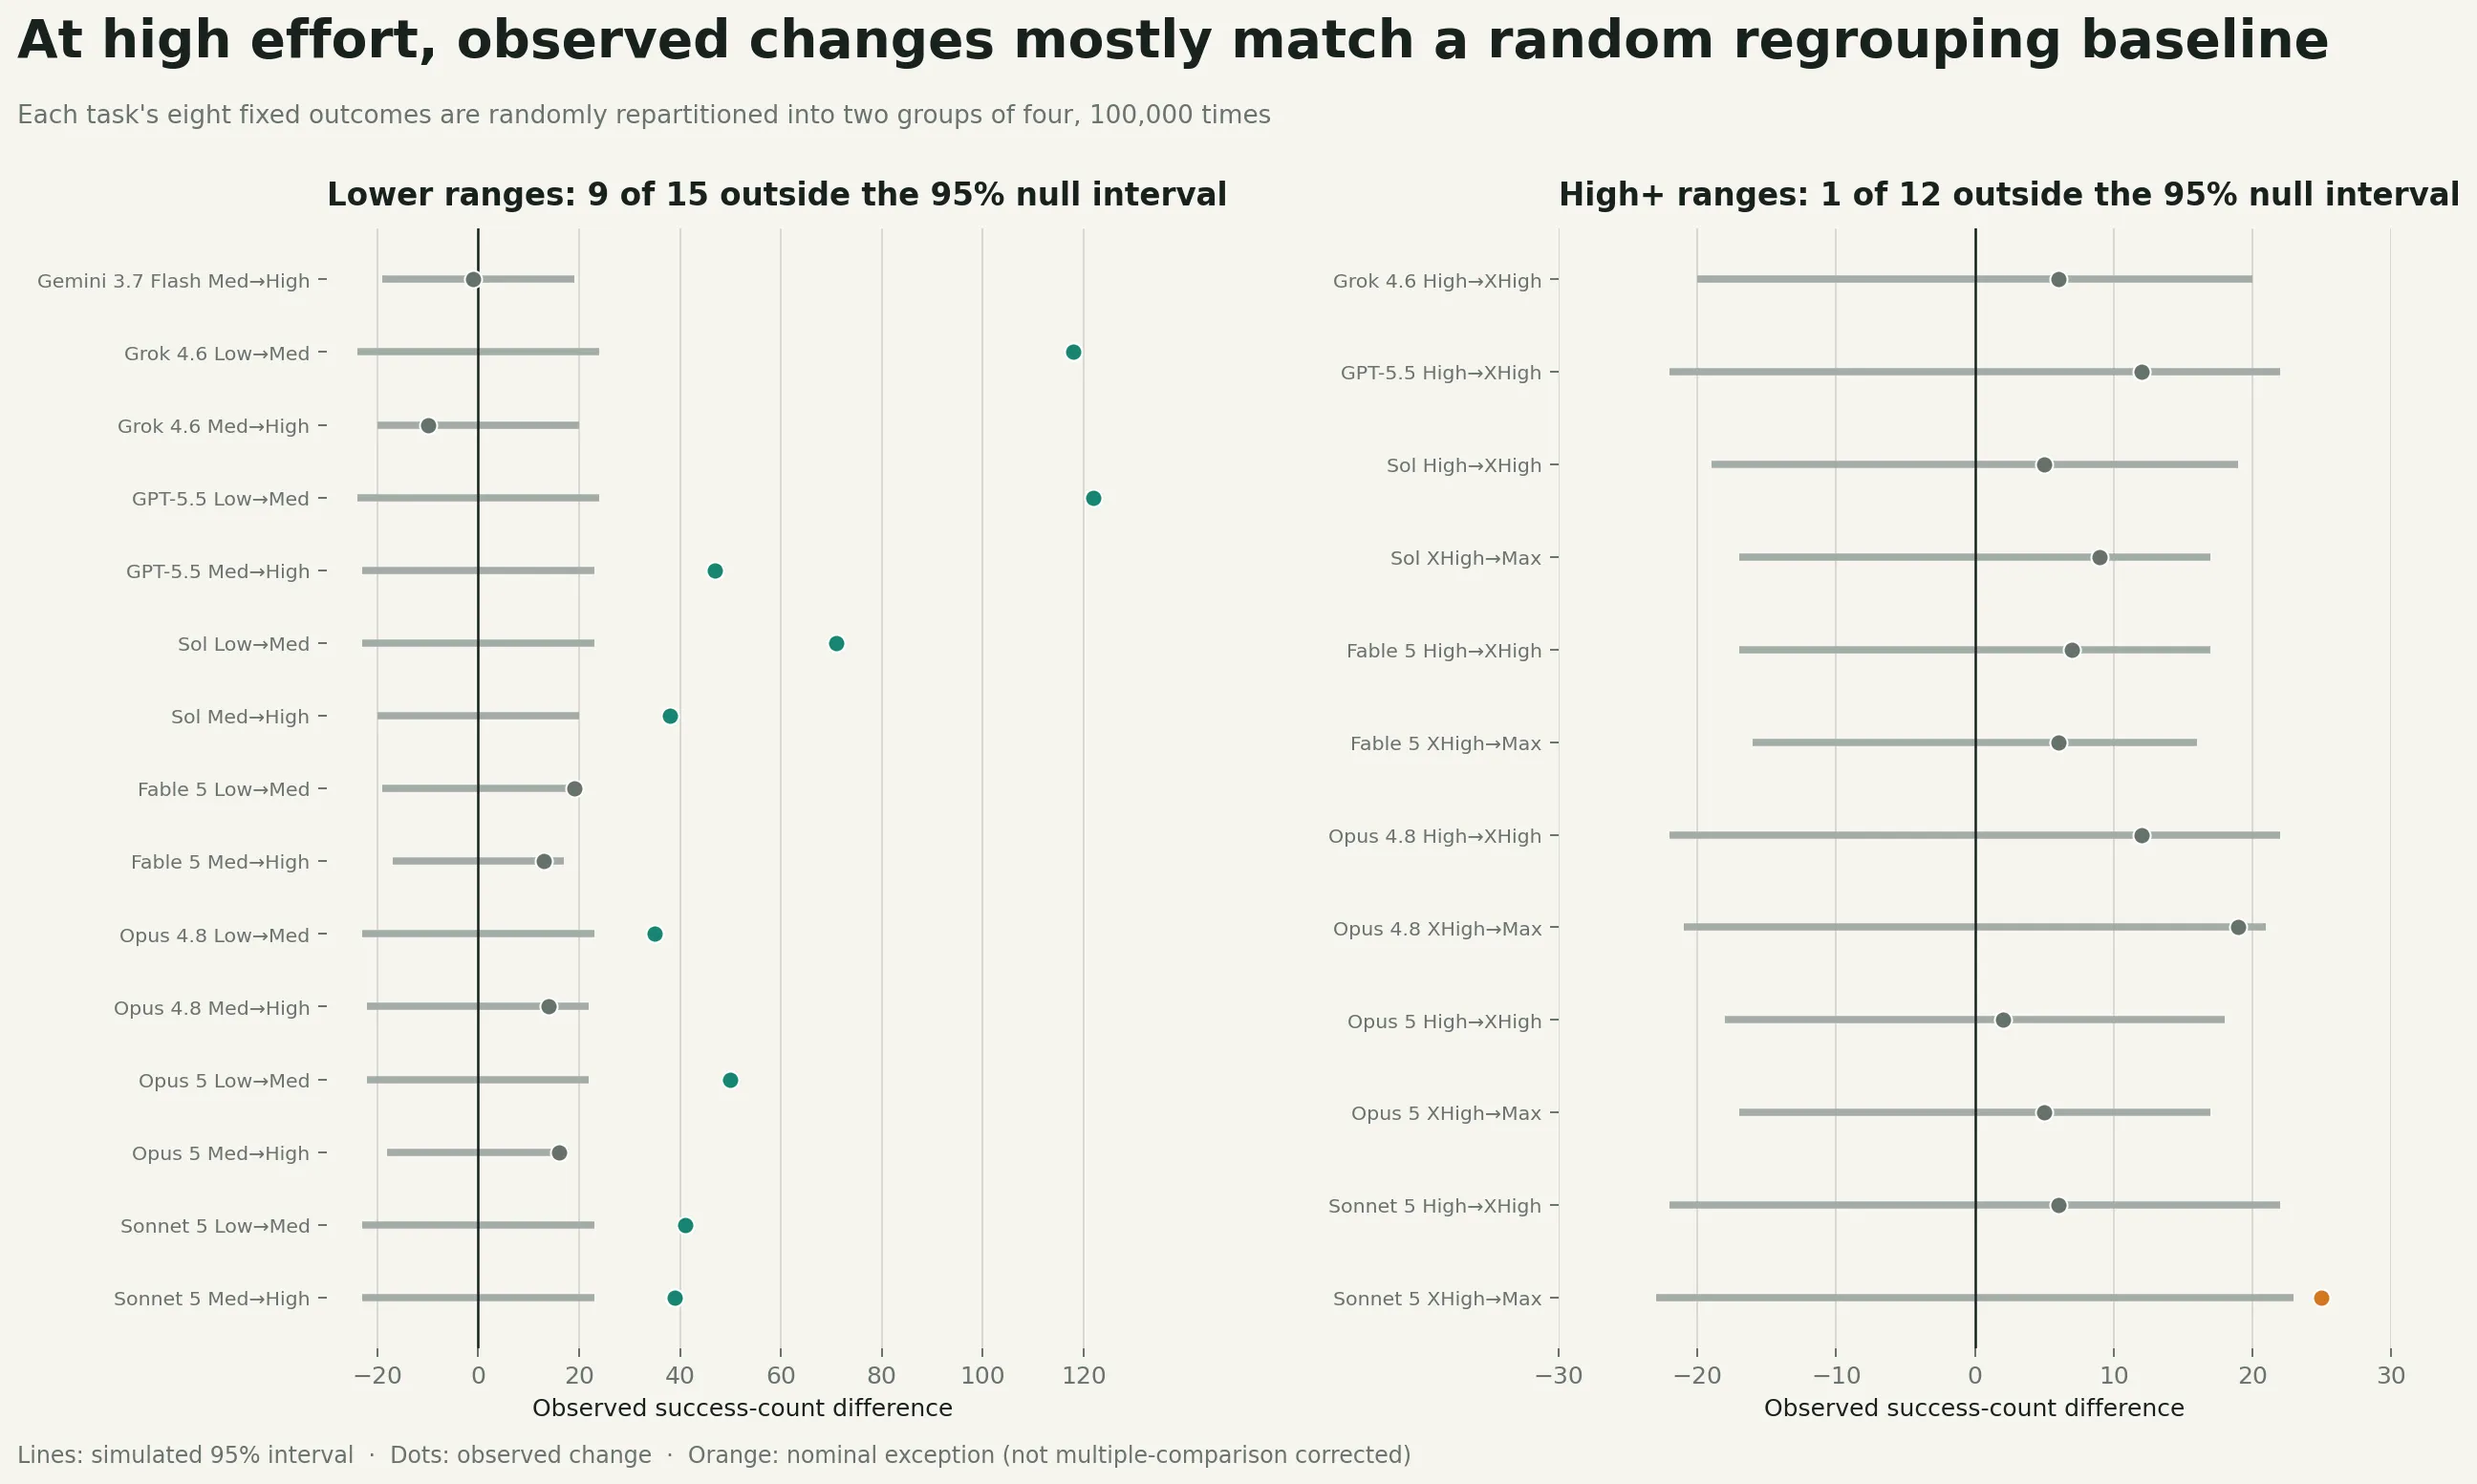
This does not make every task-level change meaningless. It says that as a group, the current high-effort results mostly fail to show a directional signal beyond what four-run regrouping can produce. The same procedure does detect gains at lower levels, so “the test is too weak to detect anything” is not a sufficient explanation.
Did the models actually use more compute?
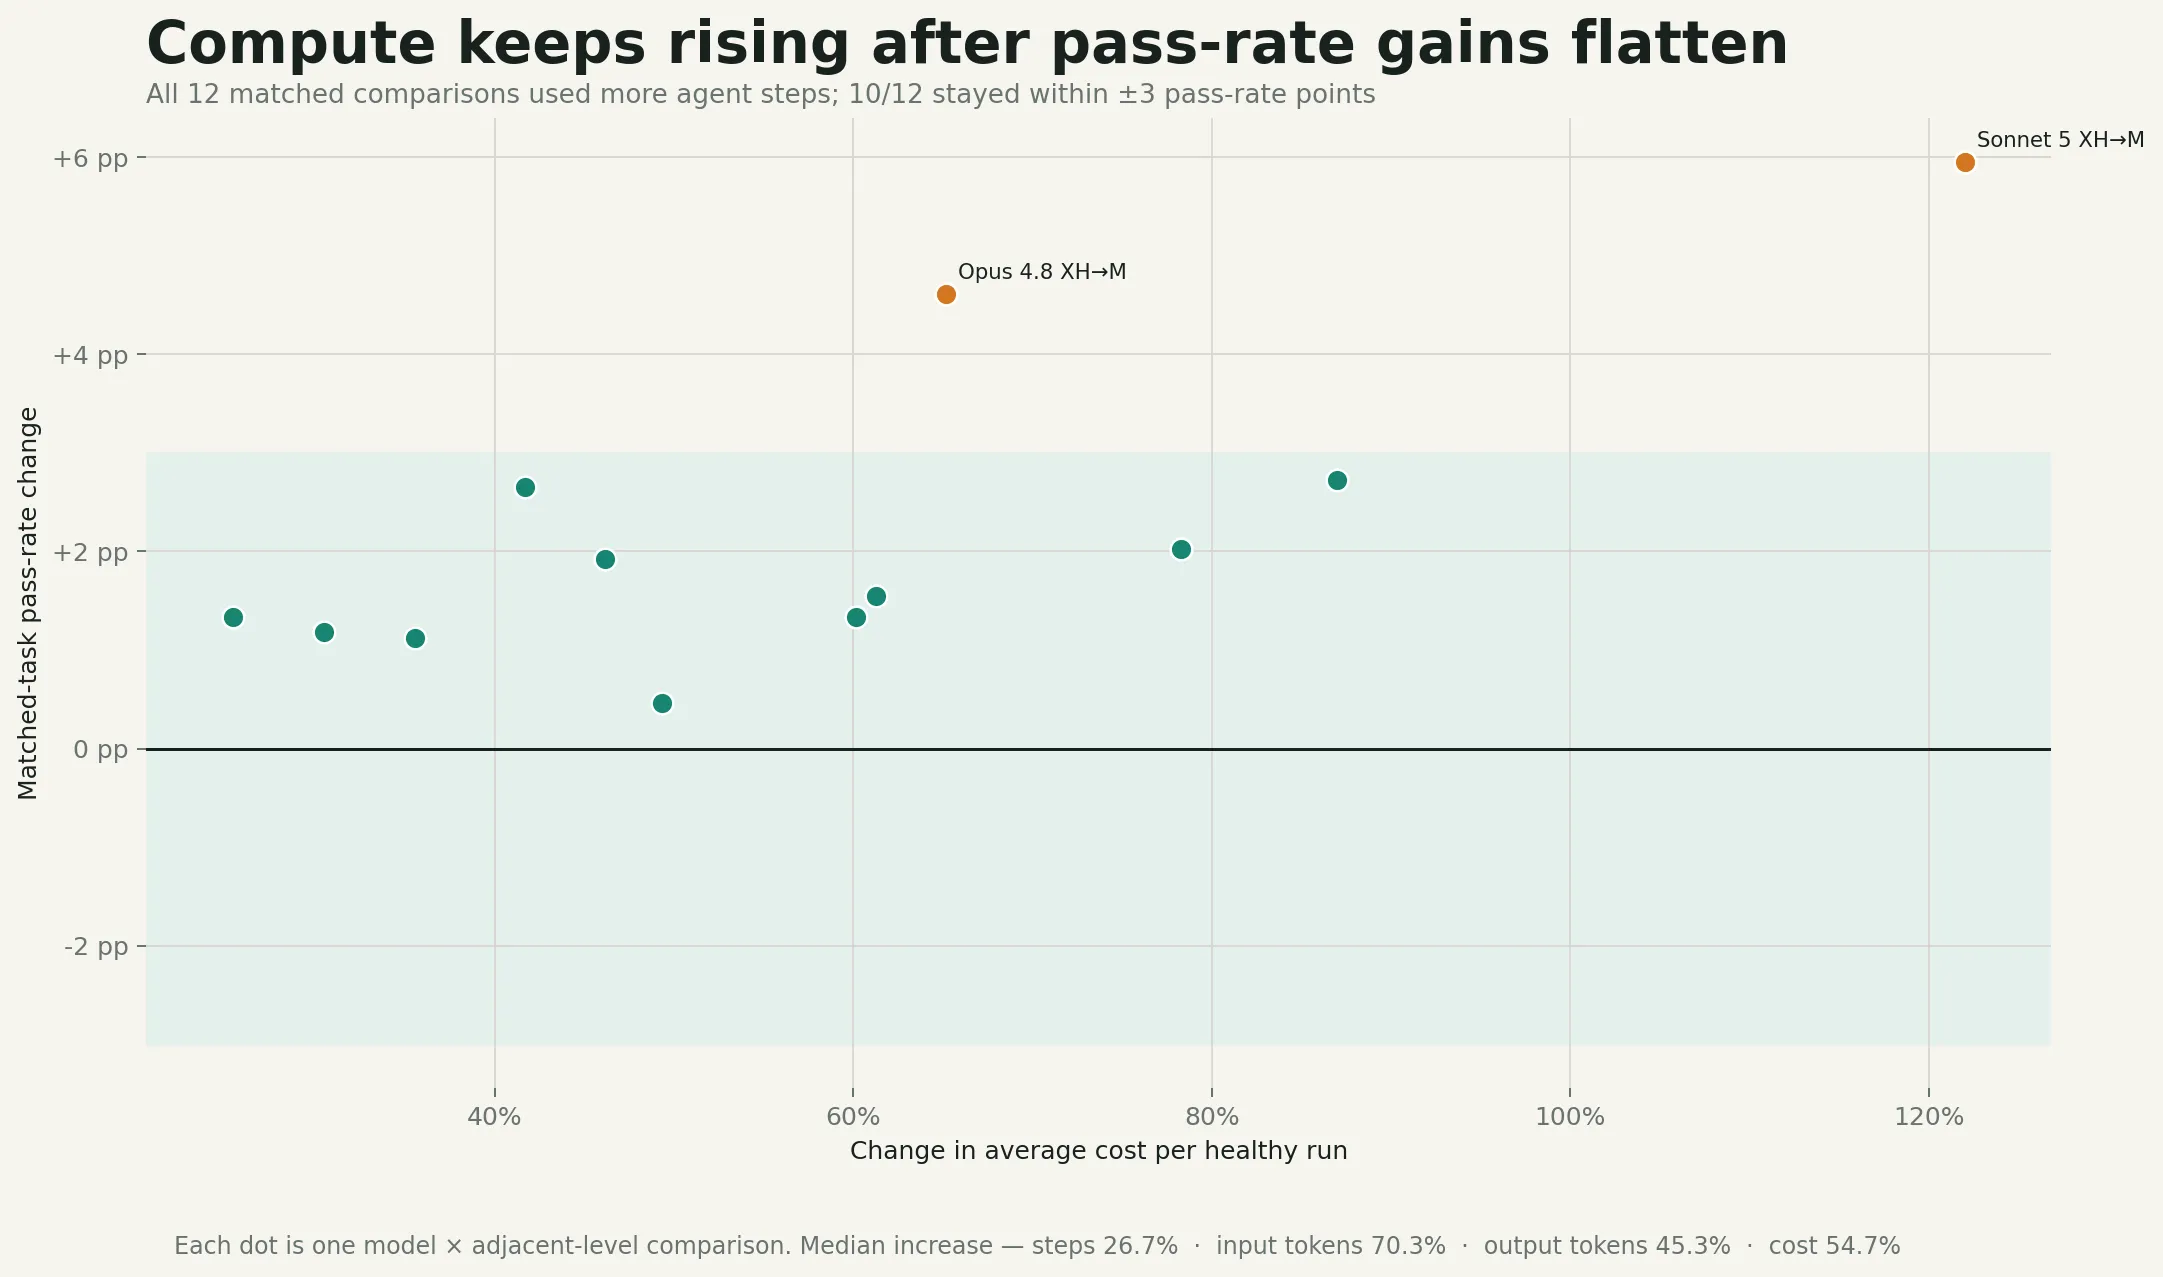
Yes—substantially more. Agent steps rise in all 12 strict comparisons. The median adjacent-level increases are:
| Process metric | Median increase across High+ comparisons |
|---|---|
| Agent steps | +26.7% |
| Input tokens | +70.3% |
| Output tokens | +45.3% |
| Cost | +54.7% |
Yet 10 of 12 matched-task pass-rate changes remain within ±3 percentage points. The two larger positive movements deserve follow-up, but they do not overturn the broader diminishing-returns pattern.
What saturates is the conversion from compute to success
The evidence supports local saturation, not a sweeping capability ceiling:
- It does not show that model capability has saturated. Better models, tools, prompts, or harnesses may still improve outcomes.
- It does not show that DeepSWE has saturated. Even the strongest configurations leave many tasks unsolved.
- It does not show that increasing effort is harmful. All 12 strict matched-task pass-rate differences are non-negative; most are simply small, and 11 of 12 remain inside the regrouping interval.
- It does not establish High as a universal optimum. Effort labels are ordered settings within a model, not equivalent compute budgets across models.
The precise conclusion is: on this DeepSWE v1.1 snapshot, once reasoning enters the region above High, the cost of additional measured test-time resource use remains obvious while task-success gains that can be resolved with four repetitions approach this evaluation design’s detectable signal floor.
That is also why this post keeps the critical reasoning path instead of publishing only “above High looks random.” A result-only version would turn a bounded statistical statement into a slogan. The comparison rules, task-level churn, random baseline, and compute measurements show where the conclusion applies—and where it does not.
Limitations and next steps
Four repetitions are still shallow, especially for estimating per-task success probabilities. The regrouping test also targets only a simple no-level-effect null. The most useful next step is not another leaderboard view, but deeper repetition on a small preregistered boundary set; a declared multiple-comparison rule; and separate reporting of aggregate score, task coverage, repeat stability, trajectory length, and cost.
If deeper repetition reproduces the same pattern, we can say with greater confidence that the issue is not whether the models continue to “think,” but whether that extra compute still changes task outcomes reliably.